Discoveries fluctuate from year to year obscuring the long-term systematic trends. But a smoothed curve of discoveries over 10-year intervals gives a rather smooth curve. The following figure is smoothed such that the average discovery from 1956 to 1965 is attributed to 1960.
The peak around 1960 stands out clearly. The subsequent downward discovery slope is more logarithmic than linear, suggesting by extrapolation that about 134 billion barrels will be found over the next 30 years. That would not be a bad achievement, being more than double the North Sea, which is the largest new province found since the Second World War. But it comes far short of providing sufficient to meet the IEA scenario which visualizes the consumption of 1000 billion barrels over the next 25 years, even though some of it may be drawn from reserves left from past discovery. The growing gap between consumption and discovery looks like the jaws of a hungry wolf. We may conclude that, yes, “the wolf is coming.”
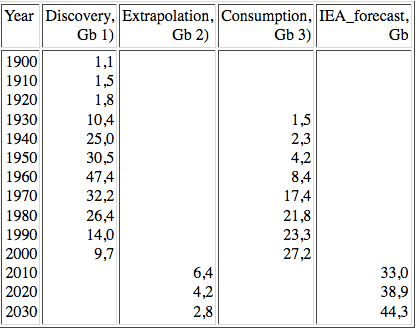
Discovery the next 30 years = 10 * ( 6,4+4,2+2,8) = 134 Gb
- The average discovery per year from 1956 to 1965 is attributed to 1960, etc
- Extrapolation from a logarithmic fit to the data for 1970 – 2000
- The average consumption per year from 1956 to 1965 is attributed to 1960, etc